Did Democrats really "materialize" 20 million new votes in the midterms?
Did Republican House votes stay flat while Democrats 'materialized' about 20 million new votes in the 2026 midterms compared with 2022, as a viral chart reposted by Trump claims?
Misleading
The surge is real and documented. The suggestion that voters appeared from nowhere is not.
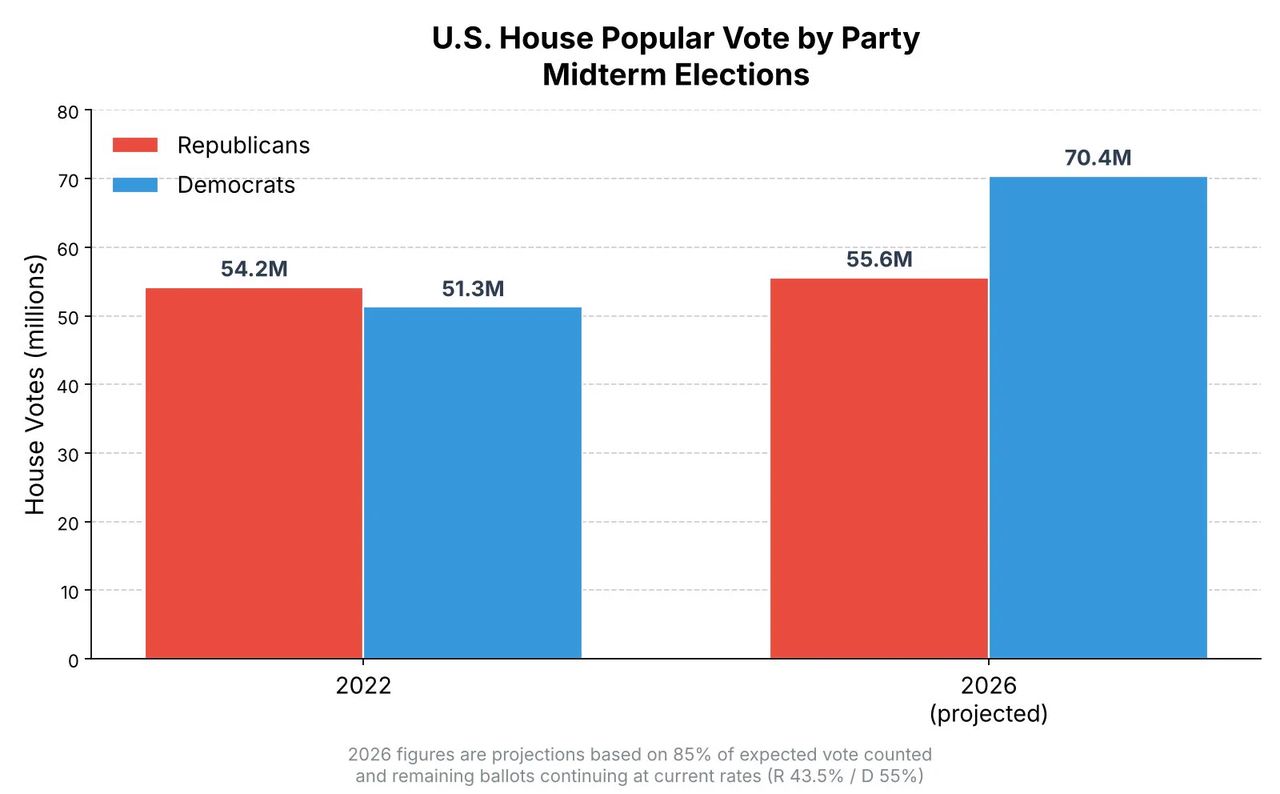
The chart's numbers are broadly right. Democratic House votes did rise from about 51 million in 2022 to roughly 70 million in 2026, while Republican votes barely moved. But the caption's claim that Democrats "materialized" those votes insinuates fraud. About 124.3 million people voted — record midterm turnout — and Democrats won the House vote by the largest margin since 1974. No evidence of widespread fraud has emerged.
 Likely genuine
Claims
✓ 3 trueDemocrats 'materialized' about 20 million new votes, implying the extra Democratic votes were illegitimate or fabricated.12567
“Democrats materialized 20 million new votes.”
The size of the Democratic increase is real, and that is precisely what makes the wording work. What the word 'materialized' adds — that these ballots appeared without voters behind them — is contradicted by the record. About 124.3 million people voted in the 2026 midterms, a turnout rate of 49.4 percent of eligible voters and the second-highest midterm figure since 1914. Democrats won the national House vote by 12 to 14 points, the largest midterm margin since 1974, and first-time midterm voters backed Democrats 64 to 34. When millions of new and irregular voters enter an electorate, one party's totals rise sharply and the other's do not; that is the expected result, not an anomaly. The same shape appeared in 2018, when House Democratic votes climbed from about 35.6 million in 2014 to roughly 59 to 60 million while Republican votes moved far less. Two independent fact-checkers have separately addressed 'stolen election' claims circulating after this vote, and neither found a mechanism for fabricated ballots. The caption is a factual number attached to a false inference.
In the 2022 midterms, House Republicans received about 54.2 million votes and House Democrats about 51.3 million.3
This is the baseline the whole chart rests on, and it holds. The 2022 bars match the widely reported national House popular vote for that cycle — roughly 54 million for Republicans and 51 million for Democrats — and coverage of the dispute itself uses the same starting numbers, which suggests the chart's author did not invent them. That matters for how a reader should weigh the post: the creator of a misleading graphic is not necessarily careless with figures. Here the chart is accurate at every point we can test, and the misleading element sits entirely in the caption's interpretation. Knowing that the baseline is sound is what allows us to say the problem is the framing rather than the data. It is also a warning against the reflex that a post is wrong because it is misleading; the two questions are separate.
In the 2026 midterms, House Democrats received about 70.4 million votes versus about 55.6 million for Republicans.12
We can rate this likely true rather than true because the chart itself says these are not final numbers: the 2026 bars carry a '(projected)' label and a footnote describing the method, at roughly 85 percent counted. Independent reporting is consistent with the projection. NBC News had House Democrats at 55.3 percent and Republicans at 43.3 percent of the national vote, and against a total ballot count of about 124 to 128 million that implies roughly 69 to 71 million Democratic and 54 to 56 million Republican votes — the same shape as the chart. Final certified House totals were not yet available when we checked, which is why the confidence band is moderate and not high. A reader should treat the bars as a good-faith projection rather than a certified count, and should not assume the word 'projected' was added to hide anything.
Still open: Final certified national House totals were not available at the time of checking, so the projected figures could shift slightly.
Republican votes stayed the same.23
This is close enough to be fair. Republican House votes moved from about 54.2 million in 2022 to roughly 55.6 million projected in 2026 — a small increase, not a decline, but small enough that 'stayed the same' is a reasonable shorthand. The turnout data explains why. Republican-leaning turnout was roughly flat while the electorate as a whole skewed about three points more Democratic than in 2024. In other words, the Republican number did not need to fall for Democrats to win by double digits; the pool changed around it. That detail is the part of the post that is least misleading, and it is worth separating from the caption's insinuation. A reader weighing the post should notice that the two halves of the caption are not equally sound: one describes the data accurately, the other draws a conclusion the data does not support.
What was posted
XA post on X by Kevin Bass pairs a bar chart titled "U.S. House Popular Vote by Party Midterm Elections" with a two-line caption. The chart shows Republicans narrowly ahead of Democrats in 2022, then a wide Democratic lead in 2026, with the 2026 bars labelled as projections at roughly 85 percent counted. The caption asks readers to believe the Democratic increase is anomalous and unexplained.
“Republican votes stayed the same. Democrats materialized 20 million new votes.”
Posted on X on 5 November 2026 and later shared by Donald Trump on Truth Social, from where the chart circulated much more widely.
Who posted it
XAccount check
Estimates from public signals — account age, posting pattern, audience — not a judgement of the person behind the account, and separate from whether this post is true.
What stood out
- Handle belongs to a real, publicly identifiable person: Kevin N. Bass, PhD (cell biology/biochemistry) and MS (immunology) from Texas Tech University Health Sciences Center; formerly an MD/PhD student dismissed in Dec 2023.
- Account is long-established — created 26 Dec 2012 (~13.9 years old) with roughly 204,000 followers per third-party trackers (Sept 2026); growth pattern is organic, not a purchased/coordinated following.
- Has genuine off-platform footprint: author of a viralled Newsweek op-ed (Jan 2023), Newsmax TV appearances (Sept 2026), podcast guest slots (Joe Rogan-adjacent shows, Doctors' Lounge, Epstein Files special), Substack writer — consistent with a single real identity rather than a sock puppet.
- Not platform-verified (no blue check in the supplied metadata) despite being a recurring cable-news and podcast commentator.
- Style is long-form, argumentative, citation-heavy threads (e.g., multi-part threads quoting Fauci/Walensky statements, Nature/NYT archives) — human-authored cadence, no evidence of automated posting.
- Sourcing is a mix of legitimate primary material (FOIA emails, WHO transcripts, published papers) and strong causal overreach, e.g. 'high likelihood of a causal link between COVID-19 vaccines and death from myocarditis' and claims that officials knowingly 'lied'; these go beyond the cited evidence.
- On 5 Nov 2026 he amplified a chart claiming 'Democrats materialized 20 million new votes' in the midterms; the figure was picked up by election-fraud promoters (Liz Harrington, Joe Hoft, The SCIF) and is explained by ordinary presidential-vs-midterm turnout differences per NBC News analysis of the historic Democratic margin — no evidence of fraud has emerged.
- No formal fact-check rating (PolitiFact/Snopes/Reuters) located, but his vaccine-safety and public-health-establishment claims are widely contested by mainstream scientists and were flagged as unsupported by critics.
- Self-described current work at a think tank 'characterizing media and government bias and infectious disease misinformation'; frames himself as a whistleblower against Texas Tech, which raises advocacy incentives.
- Mixed-reliability pattern typical of a real partisan commentator: accurate on some documented facts, unreliable on causal and election-integrity inferences.
Signals (11)+
- Account created
- 2012-12-26
- Follower count estimate
- 204232
- Follower growth
- Slow/organic (+0.7% per month, Sept 2026)
- Real name identified
- Yes
- Credentials
- PhD Cell Biology & Biochemistry, MS Immunology (TTUHSC); former MD/PhD student
- Posting cadence
- High — multiple posts/threads per day, long-form text with citations
- Notable news coverage
- Newsweek op-ed, Jan 2023; Newsmax appearance, Sept 2026; The Western Journal, Nov 2026; Instapundit, Jun 2025; Hacker News submissions of his threads
- Affiliations
- Self-described think-tank researcher; Substack (@kevinbass); litigant in Bass v. Texas Tech HSC
- Fact check history
- No major fact-checker rating found; vaccine-causality and election-integrity claims contested/unsupported
- Controversial claims
- 'Democrats materialized 20 million new votes' (5 Nov 2026) — amplified by election-fraud accounts; COVID-19 vaccine / myocarditis causal claim; Allegations officials knowingly 'lied' about vaccine transmission
- Bot signals
- None detected — consistent voice, long history, real-world media footprint
Account checked November 8, 2026, 02:48 UTC
The media
Image✓ What is genuine
The chart is a genuine data graphic built on real published vote statistics; its 2022 figures and 2026 projection both track the reporting. What is not genuine is the caption's inference, which the chart itself does not contain.
The tells
- ●●○ Supporting signal The 2026 bars are marked '(projected)' with a footnote describing the projection at roughly 85 percent counted, so the graphic does not pass a projection off as a final count.our visual review
- ●●○ Supporting signal The 2022 bars match the widely reported totals for that cycle, which is what an accurate data graphic would look like.our visual review and source 3
- ●●● Strong signal The implied percentage split matches NBC News' tally, so the chart's totals are consistent with independent reporting rather than invented.source 1
Synthetic-media detector
Detector not consultedThe media is incidental to the claim; the detector was not needed.
How we checked the media
- Reviewed the chart visually: fonts, axis labels, gridlines and footnotes are internally consistent, and the 2026 bars are explicitly labelled as projections.
- Compared the chart's 2022 bars against the widely reported national House popular vote totals for that cycle.
- Compared the projected 2026 percentage split against independent reporting and the total ballot count to see whether the totals implied by the chart match.
Sources
10 sources reviewed- 1Sizing up the blue wave: From the Politics Desk ↗
NBC News · nbcnews.comReputable outletLean LeftEvidence
Establishes the national House percentage split of 55.3 percent Democratic to 43.3 percent Republican and the 12-point margin.
- 2This Is What Happened on Tuesday ↗
WCBM (citing University of Florida Election Lab) · wcbm.comUntiereduntiered — treated as signal only, never decisiveEvidence
Establishes 124.3 million ballots cast, 49.42 percent turnout, and first-time midterm voters backing Democrats 64 to 34.
- 3Startling Chart Projects Mind-Boggling Surge in 2026 Ballots Just for Dems, Unprecedented in US History ↗
The Western Journal · westernjournal.comUntiereduntiered — treated as signal only, never decisiveEvidence
Confirms the chart shows about 70 million Democratic to about 55 million Republican votes and that no evidence corroborates the implied fraud.
- 4Trump shares posts questioning midterm election results ↗
Yahoo News Canada · ca.news.yahoo.comUntiereduntiered — treated as signal only, never decisiveContext
Documents that Trump shared the chart post and that neither post provided evidence of inaccurate results or fraud.
- 5Midterm elections: Democrats lead popular vote in House by largest margin in history ↗
The Independent (citing Cook Political Report) · independent.co.ukReputable outletLean LeftEvidence
Citing the Cook Political Report, documents the historical scale of House vote swings and record turnout.
- 6New York Democrats Won Big on Election Night, But Many Legislative Wins Were Razor-Thin ↗
Gotham Gazette · gothamgazette.comUntiereduntiered — treated as signal only, never decisiveEvidence
Provides the 2014-to-2018 comparison, from 35.6 million to about 60 million Democratic House votes.
- 7Prank video resurfaces in posts claiming 'stolen' US midterm elections ↗
AFP Fact Check · factcheck.afp.comPrimary / fact-checkerIFCN + EFCSN; wire-backedEvidence
Shows AFP Fact Check debunked a recycled 2020 prank video used to claim the 2026 midterms were stolen.
- 8Donald J. Trump: RT of Kevin Bass chart post ↗
Trump's Truth · trumpstruth.orgUntiereduntiered — treated as signal only, never decisiveContext
Records the chart's title, its projected 2026 totals and the 5 November 2026 posting timestamp.
- 9Record voter turnout marks 2026 midterm election ↗
ABC News (via Flipboard) · flipboard.comUntiereduntiered — treated as signal only, never decisiveEvidence
Independently confirms more than 124 million ballots were cast, per the University of Florida Election Lab.
- 10Fact-check — Lead Stories ↗
Lead Stories · hoax-alert.leadstories.comPrimary / fact-checkerIFCN; strong on viral/AI mediaEvidence
Shows Lead Stories examined and debunked related pre-election vote-switching claims.
Further reading
- 1NBC News Gives the percentage split behind the vote totals and places the 12-point margin against 2008 and 2018.
- 2WCBM (citing University of Florida Election Lab) Supplies the turnout and first-time-voter data that explain the surge.
- 6Gotham Gazette Provides the 2014-to-2018 comparison that shows the same pattern without any fraud claim.
- 7AFP Fact Check Shows how a separate but related 'stolen election' claim was examined and rejected.
The full story
The numbers on this chart are not the problem. The 2022 figures match the reported national House vote, and the 2026 projection is consistent with the percentage split NBC News was reporting as counts came in. The problem is what the caption does with them.
About 124.3 million people voted in the 2026 midterms — a turnout rate of 49.4 percent of eligible voters and the second-highest midterm figure since 1914, according to the University of Florida Election Lab. Democrats won the House popular vote by 12 to 14 points, the largest midterm margin since 1974. First-time midterm voters backed Democrats 64 to 34. When an electorate expands that much and breaks hard toward one party, that party's vote total rises by millions and the other party's barely moves. That is arithmetic, not anomaly.
The same pattern ran in 2018, when House Democratic votes jumped from about 35.6 million in 2014 to roughly 59 to 60 million while Republican votes shifted far less. Post-election claims that the 2026 result was stolen have been examined by fact-checkers, including a recycled 2020 prank video presented as new evidence; no widespread fraud has been found.
So the post works because it starts from something true. A reader who checks the bars finds them accurate, and the word 'materialized' slips past as commentary. The false part is a verb.
Kernel of truth
Democratic House votes really did rise by roughly 19 to 20 million between 2022 and 2026 while Republican votes barely moved — a real and documented swing explained by record turnout and a wave election.
Timeline
November 3, 2026
US midterm elections held; Democrats win control of the House and Senate and the national House popular vote by roughly 12 to 14 points. 1NBC News
November 5, 2026
Kevin Bass posts the House popular vote chart on X with the caption about Democrats 'materializing' 20 million votes. 8Trump's Truth
November 5, 2026
Donald Trump shares the chart post on Truth Social without evidence that the results were inaccurate or fraudulent. 4Yahoo News Canada
How it was framed
The chart's figures are accurate and the graphic is genuine, but the caption frames a real, documented turnout surge as an unexplained appearance of ballots. That is misleading use of true information to suggest a conclusion the evidence does not support.
- “Visual proof”. A clean bar chart titled 'U.S. House Popular Vote by Party Midterm Elections' presents the argument as data rather than assertion.
- Emotional language. The verb 'materialized' describes votes as appearing without people, rather than as cast by voters.
- Missing context. The caption gives no turnout figures, no margin figures and no comparison to 2018, all of which explain the pattern shown.
- Us vs. them. Two lines contrast 'Republican votes' staying put against 'Democrats' appearing, setting the parties as honest and suspect respectively.
Posted on X by Kevin Bass on 5 November 2026 and subsequently reshared by Donald Trump on Truth Social; neither post provided evidence that the reported results were inaccurate or the product of fraud, according to Yahoo News Canada.
Bias
Leans election-fraud insinuation / pro-Republican. The chart itself is a neutral-looking data graphic, but the caption's verb 'materialized' deliberately frames a documented turnout surge and historic Democratic wave as votes appearing from nowhere, feeding the post-election 'stolen election' narrative. The post stops short of an explicit fraud allegation, but the insinuation is the point of the wording.
Bias describes how the post frames its message — the slant of the language, selection and emphasis — and is judged separately from whether the claim is true. A true claim can still be framed with a strong slant.
How we checked
1 min 28 s- 1
Read the post and separated its four distinct claims: the 2022 totals, the 2026 totals, the Republican flatline, and the 'materialized' inference.
- 2
Ran searches for the national House popular vote totals, the turnout figures and any existing fact-checks on the '20 million votes' framing.
- 3
Compared the chart's 2022 bars against reported totals and its 2026 projection against NBC News' percentage split and the total ballot count.
- 4
Searched for historical comparison years, specifically the 2014-to-2018 House vote swing.
- 5
Searched fact-check archives for 'stolen election' claims tied to the 2026 midterms and reviewed the AFP Fact Check and Lead Stories entries.
✓ Claim checked✓ Media checked✓ Sources checked
Why 82% confidence
HighWe are high-confidence on the misleading verdict because the explanation for the Democratic surge is corroborated by multiple independent sources — turnout data, the percentage split, exit polling on first-time voters, and a clear historical precedent — while no source in the record supports the fraud inference. The individual vote-total claims sit at moderate confidence because final certified totals were not yet published; they are projections at roughly 85 percent counted, and we grade them accordingly.
Limits. We could not compare against final certified national House totals, which were not available. We did not run an image-forensics detector because the media was not pivotal to the verdict — the chart is a rendering of published statistics that can be checked independently. We did not establish who created the underlying chart before Kevin Bass posted it.
What we don’t know
- Whether the chart was assembled by the poster or copied from another source before it reached X.
- What the final certified national House vote totals will be once all counting and certification is complete.
- Whether the poster intended the fraud insinuation or used 'materialized' loosely.
Spot it yourself
Find the overstatementLooks suspicious, isn’t proof
- The post comes from a partisan-adjacent account and was amplified by a political figure. That tells you who is talking, not whether the numbers are wrong.
- The chart is a projection at roughly 85 percent counted, not a certified total. A projection can be imprecise, but that is not evidence of fabrication.
- A dramatic-looking bar can feel like an argument in itself. A steep line is a reason to ask what changed, not a finding.
The actual evidence
- The 2022 baseline matches the widely reported national House vote, which means the chart is accurate where it can be tested.
- The 2026 projection is consistent with NBC News' percentage split of 55.3 to 43.3 and with a total ballot count of about 124 million.
- The University of Florida Election Lab figure of 124.3 million ballots and 49.4 percent turnout explains where the additional Democratic votes came from.
- The 2014-to-2018 comparison shows the same shape occurring before, without any fraud claim attached.
- 1
Check whether the chart's numbers match independent reporting.
Find the national House popular vote percentage from a major outlet and compare it to the bars. If they agree, the chart is not the problem — look at the caption.
- 2
Ask what the caption adds that the data does not say.
Read the chart and caption separately. Here the chart shows a gap; only the word 'materialized' supplies the accusation.
- 3
Look for the denominator, not just the difference.
Search for total turnout in the election. A 20 million vote gap looks different against 124 million ballots than against 80 million.
- 4
Look for a historical comparison of the same kind.
Search whether a similar swing happened before, such as 2014 to 2018, and what explanation was offered then.
Takeaway
When a post pairs accurate numbers with a loaded verb, test the verb separately from the data. The chart can be right and the sentence can still be wrong.
Questions people ask
Did Democrats really get 20 million more votes in the 2026 midterms?+
Roughly, yes. House Democratic votes rose from about 51 million in 2022 to a projected 70 million in 2026, while Republican votes moved from about 54 million to about 55.6 million. The chart's figures are consistent with independent reporting. The question is not whether the increase happened but why.
Was there fraud in the 2026 midterms?+
No evidence of widespread fraud has emerged. Fact-checkers including AFP Fact Check and Lead Stories have examined related 'stolen election' claims and found no basis for them, including a recycled 2020 prank video presented as new proof. Election officials in multiple states have rebutted related vote-tampering claims.
Why did Democratic votes rise so much while Republican votes stayed flat?+
About 124.3 million people voted, the second-highest midterm turnout since 1914, and the electorate was about three points more Democratic than in 2024. First-time midterm voters backed Democrats 64 to 34. When the pool expands and breaks toward one party, that party's total rises sharply and the other's barely moves.
Has something like this happened before?+
Yes. In 2018, House Democratic votes jumped from about 35.6 million in 2014 to roughly 59 to 60 million while Republican votes shifted far less. Large swings in House popular vote totals between midterms are a known pattern, not a sign of fabricated ballots.
What is the problem with the word 'materialized'?+
It describes votes as appearing without voters. The increase is documented and explained by turnout and a wave election; the word implies the ballots came from nowhere, which is an accusation the data does not support. That single verb is what turns an accurate chart into a misleading post.
Go deeper
- Popular vote
- The total number of individual votes cast for a party's candidates across all races, as distinct from the number of seats won.
- Turnout rate
- The share of eligible voters who actually cast a ballot in an election.
- Misleading content
- Accurate information used in a way that frames an issue or person falsely, so the facts are real but the conclusion they are made to support is not.
- Wave election
- An election in which one party gains a large number of seats and votes, typically driven by a broad shift in the electorate.
People also search for
For educators+
- The chart's numbers check out. Does that make the post trustworthy? Where exactly does the misleading part begin?
- If turnout had been 80 million instead of 124 million, how would that change what the 20 million vote gap means?
- Why might a reader share a chart like this without checking it, and what would a quick check have shown them?
About this check
- Platform
- X
- Posted by
- @kevinnbass
- Posted
- November 5, 2026
- Age when checked
- Older post, still live
- Where it spread
- United States
- Audience
- US audience
- Language
- EN
- Status
- ● Post is live
- Verified
- November 8, 2026, 02:50 UTC
- Published
- November 8, 2026, 02:50 UTC
Reach. 67,296 likes on Bass post (x-syndication, 8 Nov 02:31Z); Dave Rubin quote-post 12,446 likes; reposted by Trump on Truth Social 7 Nov (trumpstruth.org/statuses/43503)
This verdict was generated with AI from the sources shown. AI can make mistakes — check the sources before relying on it.
Check anything yourself, in seconds.
Share any social post or video to What the Fact and get the verdict, the confidence, and the receipts.